
WHERE DOES THE MINERAL KING WEATHER FORECAST AND WEATHER DATA COME FROM?
MINERAL KING WEATHER FORECAST
The weather forecast comes directly from the National Weather Service (NWS) and is updated every 30 minutes (whether it has changed or not). Weather forecasts by the NWS are a complex endeavor. Not only do they use current weather observations but also employ complex models to propagate known atmospheric observations to a time in the future. In doing so they utilize surface, upper atmosphere, radar, satellite, balloon and other data as their starting point. They specifically declare how far into the future you can trust their predictions. When observing NWS data products you might see words similar to VALID 1700Z which simply means the prediction is good until 5:00 PM UTC (Greenwich Mean Time).
Does the NWS actually make a forecast for the Mineral King Valley? Yes. In fact, the NWS has divided the entire United States into 5 km X 5 km grid points (about 3 mi X 3 mi) and their software models make a separate prediction for each and every grid point. The weather forecast for the MK grid point can be found on a server located at the regional NWS Service Center in Hanford, California. The website for the MK webcam simply collects the forecast from the NWS and abbreviates it as necessary to fit into a few relevant lines on the webcam site. This happens automatically every 30 minutes throughout the twenty-four hour day. Based on experience, the NWS tends to be very conservative in their predictions. If they predict a 50% probability of rain it may well be raining at that very moment! During dynamic weather conditions you may see the weather forecast change radically at each 30 minute update.
MINERAL KING TEMPERATURE AND WIND DATA
Determining the current temperature and wind at Mineral King requires using scientific and mathematical deduction. Since the webcam electronics is unpowered except when taking an image it is not practical to make a real-time measurement of current weather conditions in the MK Valley. The temperature sensor at the camera only reports data when the camera is powered (and, hence, never at night) so it is necessary to observe other nearby temperature sensors and adjust their measurements to the altitude and location of the MK Valley. To accomplish this the MK website observes temperature at five different nearby locations: two in Pumpkin Hollow north of Three Rivers, one at Giant Forest, one at Marble Fork (middle fork Kaweah River inside the Park) and one at Case Mountain. All these sensors are within a few miles of the MK Valley and are distributed across the mouth of the canyon through which the East and South Forks of the Kaweah River flow. The temperature measurements are then adjusted for altitude using the tropospheric lapse rate to transform their values to what they would be at the elevation of the webcam.
For instance, for a temperature measurement made at Pumpkin Hollow (elevation about 1,200 feet) the value is adjusted to what it would be if you climbed up a tall ladder to the webcam altitude (7,830 feet). Using the tropospheric lapse rate, the temperature difference between Pumpkin Hollow and the webcam location would be (7,830-1,200)*0.003566 = 23.6 degrees F. Accordingly, for a 100 deg F summer day in Pumpkin Hollow, the temperature at Mineral King would be about 76 deg F. A similar computation is made for each of the five sensors and their adjusted values are then combined using a weighted average. If a particular sensor is temporarily unavailable (happens all the time) then its weighting is added to that of one of the good sensors. The weighted average is computed independently every 30 minutes and displayed on the webcam website. Comparison with the webcam temperature sensor when the camera is operating shows close agreement.
A topographic map showing the locations of the five sensors used to deduce MK temperature is below. The scale of the map on most computer displays is about 1:200,000 . That makes the map about 15-20 miles wide. The topographic placement of the sensors is such that they are essentially connected to Mineral King by an "atmospheric tube" that is the canyon created by the East Fork of the Kaweah river.
Wind measurements are a little trickier. First, ask yourself the question "Why am I interested in wind?" Your answer is likely to be that wind speed and direction often indicate where future weather systems are coming from. To most people a wind from the southwest means something very different than a wind coming from the north since typical weather patterns tend to follow repeatable paths. Now measuring wind right at Mineral King would present a problem because the MK Valley is bifurcated; one path going northeast flowing through Sawtooth Pass, the other path heading southeast and flowing through Farewell Gap. Hence, the topography right at the webcam would grossly distort the wind measurement. Wind speed would also be grossly affected due to Bernoulli's Principle since both paths narrow as they progress higher in altitude. An ideal wind measurement would be one made on a point jutting out into the wide mouth of the Kaweah canyon since it would indicate the speed and direction of the bulk mass of air flowing over the region.
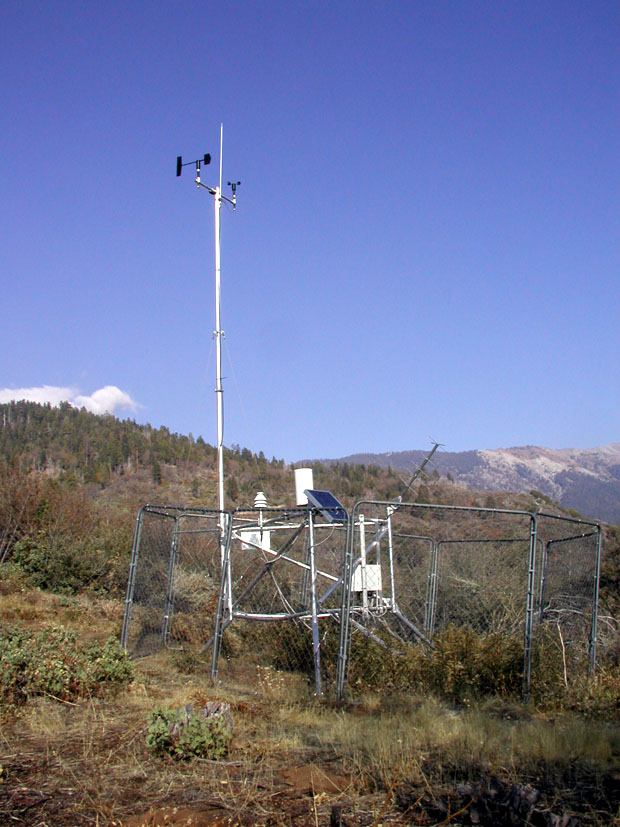
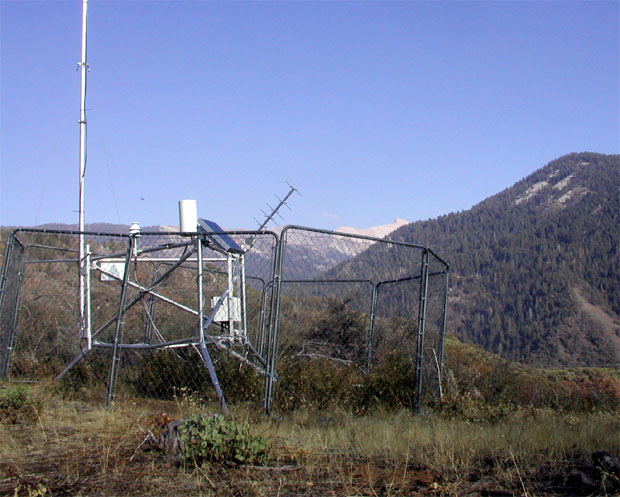
Fortunately, such a measurement is available from a NOAA weather terminal located at Wolverton Point, between Slapjack Creek and Redwood Creek, near the site of the old Wolverton homestead. Whereas temperature measurements at Wolverton are not used because of fluctuating local thermal conditions, the wind measurements are extracted, transmitted via satellite, and displayed on the webcam website. Two photos of the Wolverton wind measurement terminal are shown below.
Finally, data latency is a minor problem in presenting the data on the website. Every 30 minutes the data are updated but each update is derived from measurements made during the past half-hour. And the new update will be on the website for the next half-hour. In order to partly correct for data latency the website shows values that are extrapolated ahead in time by 15 minutes, i.e. midway until the next website update. All data presented are rounded to the nearest integer; after all, who would be interested in seeing a temperature value of 52.0733951 degrees that was only accurate to 1 or 2 degrees anyway?