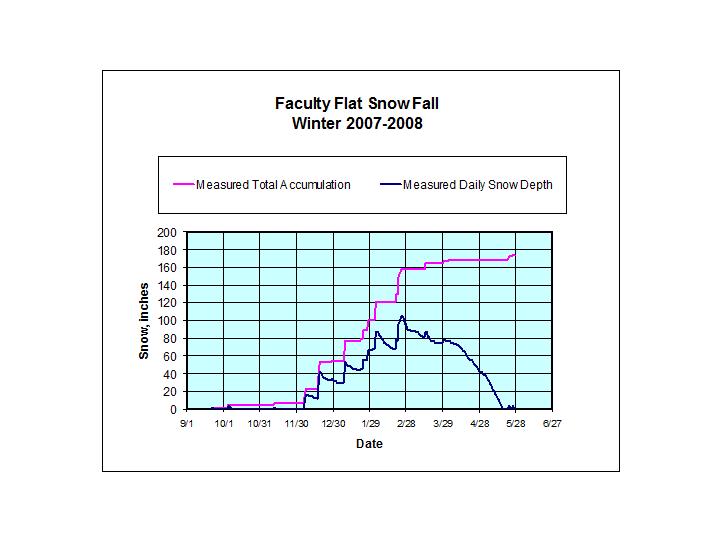
The chart above plots the total snowfall accumulation at Faculty Flat as a function of time (date) in magenta, and the measured depth of the snow on the ground on a daily basis in blue. The measured depth is determined by measuring the depth of the snow at the snow pole in each daily webcam image.